Turn CSV orders into an Excel report
Use synthetic orders to calculate revenue, build Excel formulas and a category chart, and reconcile the result against known totals.
By Tokeny · Maintained by the Tokeny team · · Applies to Tokeny 1.7; check your installed tools
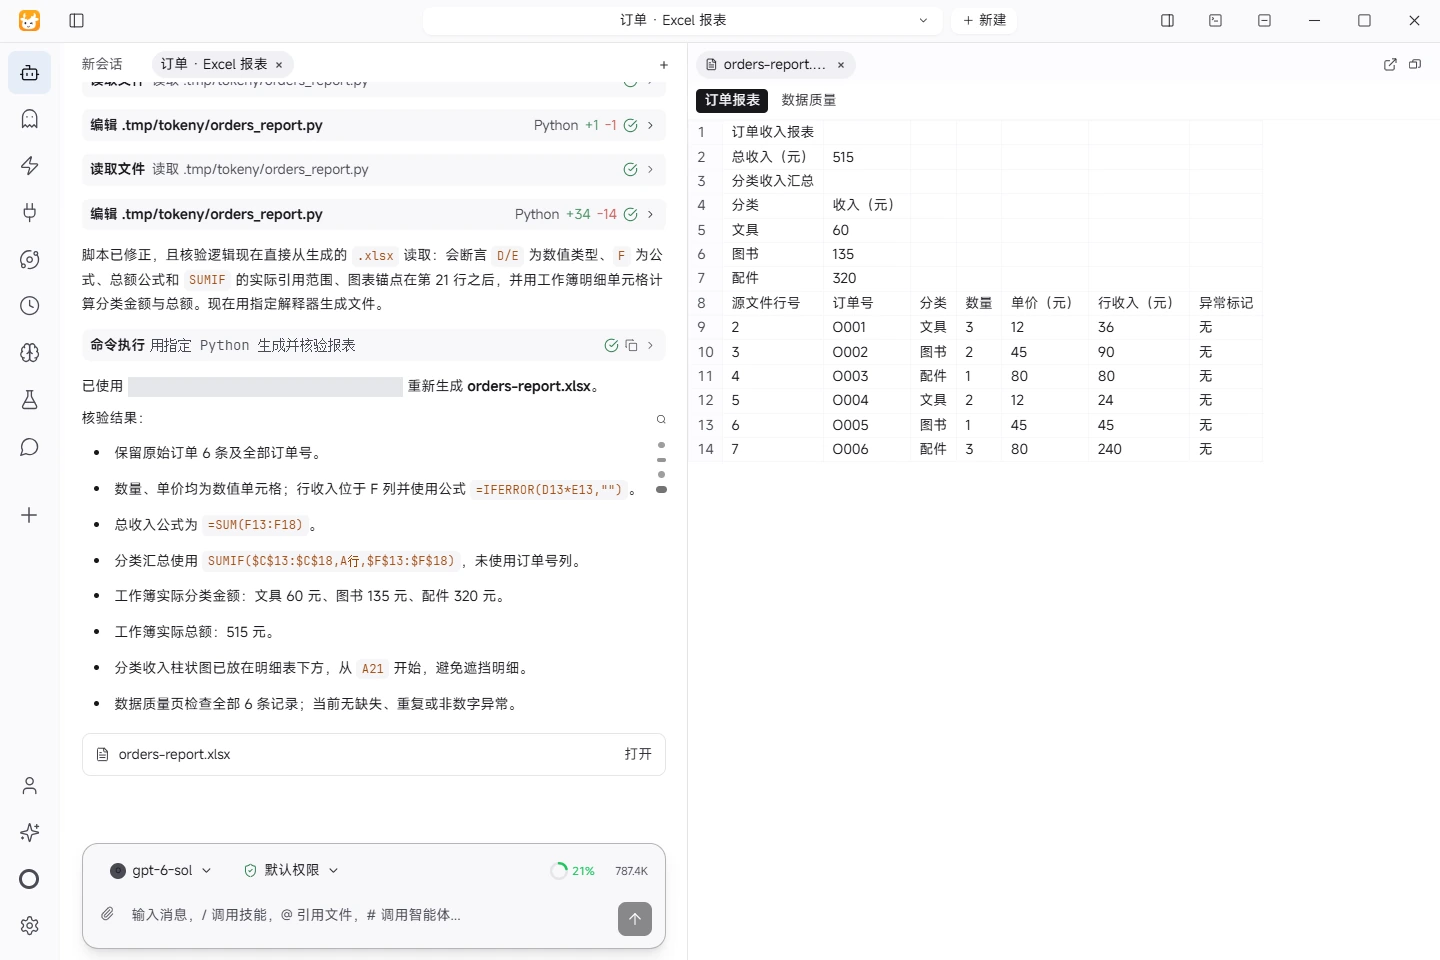
Actual task screenshot. The actual generated workbook. After reviewing and correcting the initial formulas, Microsoft Excel recalculated category totals of CNY 60, 135 and 320, totaling CNY 515. View full size ↗
Tested on November 5, 2026 · Windows · Tokeny 1.7.6 · gpt-6-sol online model · Synthetic input. Screenshots and output files use the Chinese interface and content.
Goal and input
Turn six synthetic orders into an Excel report that can be reconciled. The useful outcome is a consistent set of source rows, formulas, category totals and a chart. This workflow applies to Tokeny 1.7 with a working model and spreadsheet-generation tools.
Download orders.csv into a separate workspace. It contains order identifiers, categories, quantities and unit prices, without customer data. Amounts are in CNY. Row revenue is quantity multiplied by unit price, excluding tax, discounts and refunds.
Prompt for Tokeny
Read orders.csv and create orders-report.xlsx. Preserve all source rows and order identifiers. Calculate each row's revenue with Excel formulas, summarize revenue by category and add a category revenue column chart. Show total revenue at the top. Flag missing, duplicate or nonnumeric data instead of silently dropping it. Save the file, reconcile the row count and totals, and explain the calculation basis.
Check the workspace path and column names first. If spreadsheet tooling is unavailable, configure the required capability before continuing. Renaming a Markdown table to .xlsx does not create a workbook. Browse the skills catalog and review the source and requirements of any spreadsheet skill.
Expected reconciliation
| Category | Calculation | Revenue (CNY) |
|---|---|---|
| Stationery / 文具 | 3 × 12 + 2 × 12 | 60 |
| Books / 图书 | 2 × 45 + 1 × 45 | 135 |
| Accessories / 配件 | 1 × 80 + 3 × 80 | 320 |
| Total | 60 + 135 + 320 | 515 |
There should be six rows and six unique order identifiers. With quantity in column C and price in column D, a row formula can be =C2*D2. Use SUMIF for category totals and SUM for the grand total. Adjust row references if the output places headers elsewhere.
Validation and troubleshooting
Open the workbook. Confirm amounts are numeric cells or formulas, rather than text containing currency symbols. Check that formulas cover all six rows and chart values match category totals. Temporarily change a quantity from 3 to 4: its revenue and the grand total should increase by the corresponding unit price. Restore the input afterward.
For unreadable Chinese text, import the CSV as UTF-8. For zero totals or formula errors, check whitespace, thousands separators and text formatting. Preserve duplicate identifiers until the business rule for handling them is confirmed.
Download the actual generated workbook. Tokeny 1.7.6 on Windows used the online gpt-6-sol model and the spreadsheet skill. The run needed an available Python/openpyxl environment and human feedback to correct numeric types, formula references and chart placement; it did not pass on the first attempt.
Microsoft Excel opened and recalculated the workbook: six orders, category totals of CNY 60 / 135 / 320 and a grand total of CNY 515. Changing the first quantity from 3 to 4 produced CNY 527; restoring it returned CNY 515. The download includes recalculated values with the original quantity restored. The screenshot shows Tokeny's table preview; use Excel for full formatting, charts and recalculation after edits. The local Python path is redacted in the screenshot.
Found an issue? Include the page, app version and steps: tokeny@techxh.cn
Start with a practical guide
Install Tokeny and complete your first task
Choose an installer, configure a model and create a workspace. Complete a small task with an outcome you can verify.
Models and data flows
Compare your own API key, Tokeny channels and local models. Understand which data leaves your computer and how to check your setup.
Install, verify and troubleshoot MCP servers
Connect MCP servers with verified MarkItDown and Serena commands. Review versions, tool discovery and the limits of six server checks.
Turn CSV orders into an Excel report
Use synthetic orders to calculate revenue, build Excel formulas and a category chart, and reconcile the result against known totals.
Turn meeting notes into a Word document
Extract decisions, owners, due dates and open questions from synthetic meeting notes, then produce a Word document for review.
Skills vs MCP: differences and combinations
Skills describe workflows; MCP exposes callable tools. Learn how to combine them to convert source material and prepare a report.