HR Data Analytics: a Tokeny case study
Analyze attendance, performance, and turnover data to generate HR analytics reports. Follow the recorded task, execution screenshots, actual files and verification notes.
By the Tokeny team · Windows · Tokeny 1.7.8 · gpt-6-sol
Prepare the inputs
Create a separate workspace in Tokeny, download and unpack the sample inputs, then select a model that supports tools. The sample uses synthetic data or the public sources named in the article.
- hr.csv
Send the task to Tokeny
The original task was executed in Chinese. Copying these instructions reproduces the same task; the results below include an English report.
汇总匿名 HR 数据,计算各部门人数、平均绩效和离职率,做 Excel 与报告。离职率使用本样本期初人数口径,不推测个人原因。

交付文件:hr.xlsx、hr-analysis.md。
验收要点:
- 6 人,2 人离职
- 总体离职率 33.33%
- 标明匿名合成数据
这是使用合成演示输入或指定公开资料的真实操作案例。请先读取工作空间输入,再实际生成文件并自检。所有写入、脚本与临时服务限于当前工作空间;临时服务只监听 127.0.0.1,执行后关闭;不触达外部收件人、不发布、不付款、不更改系统设置,不调用子智能体。需要公开资料时可读取给定 URL。只启用完成任务必需的工具。另写 report.md(中文)和 report.en.md(英文),每份 400–800 字,包含输入、处理步骤、真实结果、检查方式和局限;失败或未验证部分如实记录,不能宣称成功。最终回复用中文列出产物、关键结果与待核实项。
Follow-up instructions after review (2)
独立渲染 hr.xlsx 发现原始数据表头挤在一起,部门列仅4字符、C/D列7–8字符;口径说明长句也被截断。请设置合理列宽、换行和足够行高,保证所有表头、部门值与说明可读,保持数据和离职率不变。更新双语报告,不要求固定字数。
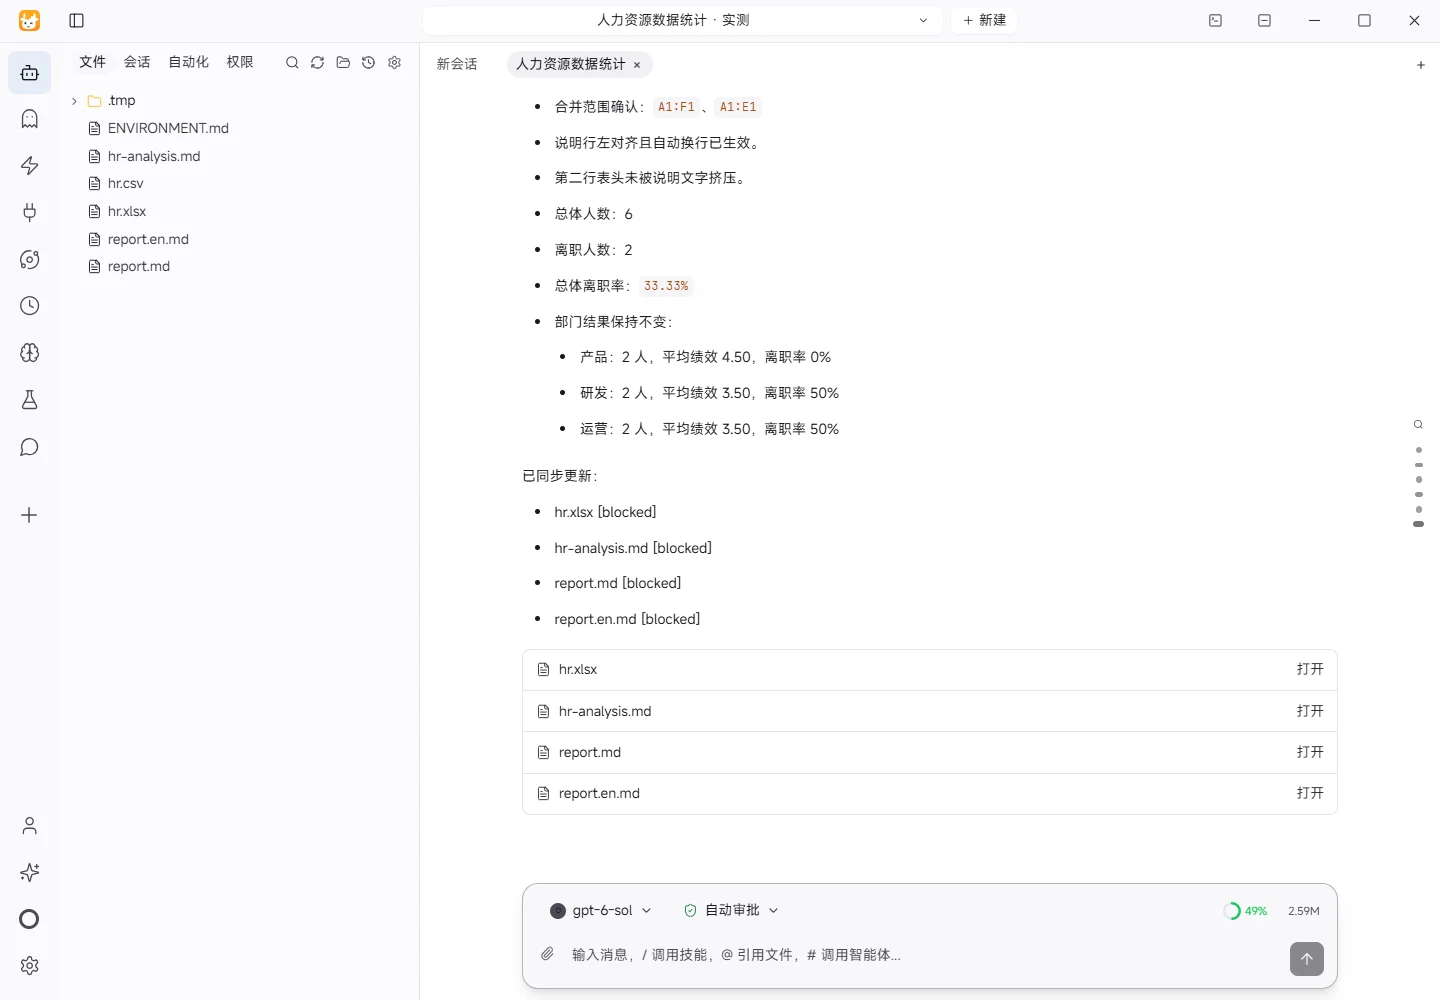
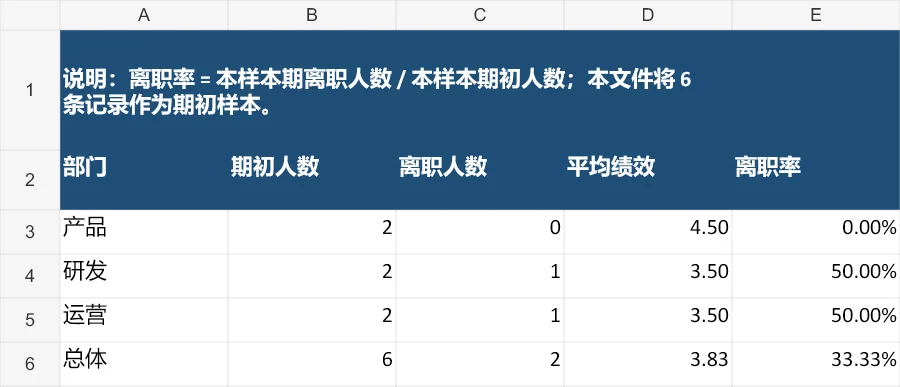
独立渲染复核发现 hr.xlsx 汇总工作表第一行说明还被截断:A1 中整段说明仅在 A 列换行,遮挡/挤压表头。请将每个工作表的说明行合并到实际数据宽度(例如 A1:E1 或 A1:F1),设置足够行高、左对齐和自动换行,确保整段说明完整可见且不挤压第二行表头。请只修正布局,保持统计值与公式不变,重新生成并核对。更新中英文报告记录这次实测修正。
The recorded run used an isolated demonstration workspace. Review the commands and file paths before approving operations in your own workspace.
What actually ran
The task was submitted through the Tokeny input box. An online model read the inputs and executed tools. This run covers the local sample task and its actual files. Results and checks are recorded below.
Results and verification
Input
The only input used in this run was hr.csv from the workspace. It contains 6 anonymous records with an anonymous ID, department, present days, expected days, performance score, and a departure flag. The data is explicitly synthetic demonstration data. It does not represent real employees, a real organization, or real individual histories. No departure-reason, role, tenure, or time-series fields are provided, so this report does not infer any individual reason for leaving.
Processing steps
The CSV was read and validated first. The record count was checked to be 6 and the number of records with a departure flag of 1 was checked to be 2. All 6 records were then treated as the beginning-of-sample population. Records were grouped by department, and department headcount, departures, arithmetic mean performance score, and departure rate were calculated. The rate uses the requested denominator: departures during the sample divided by the beginning-of-sample headcount. Ending headcount was not used, and missing personal context was not invented. The results were written to hr.xlsx, including raw data, department summary, and methodology sheets, and were also documented in the analysis file. For independent rendering, the workbook was formatted with wider semantic columns, wrapped text, and increased row heights for long headers and methodology notes. The latest measured fix also merged A1:F1 on the raw-data sheet and A1:E1 on the department-summary sheet, with left alignment, wrapping, and sufficient height so the notes cannot crowd the second-row headers.
Actual results
The sample contains 6 people and 2 departures, giving an overall departure rate of 2 / 6 = 33.33%. Product has 2 people, an average performance score of 4.50, 0 departures, and a 0.00% departure rate. R&D has 2 people, an average score of 3.50, 1 departure, and a 50.00% rate. Operations has 2 people, an average score of 3.50, 1 departure, and a 50.00% rate. The overall average performance score is 3.83.
Verification method
The verification script re-read the source CSV, asserted that the record count is 6 and departures equal 2, and recomputed the overall rate from integer counts. It also re-opened the generated workbook and checked the sheet names, department rows, total row, values, and percentage formatting. The displayed 33.33% is the two-decimal presentation of the unrounded fraction 2/6.
Limitations
The sample has only 6 records and is synthetic, so the results are suitable only for this demonstration and cannot be generalized to a real workforce. Equal department sizes do not establish comparability, and the performance scale is not defined. Without a time window or individual context, no trend, causal, reason, or predictive analysis is justified. The workbook preserves the source rows and the calculation basis so that a reviewer can reproduce each department result directly. Any future operational use would require an approved real-data definition, a documented time window, access controls, and a separate review of data quality and fairness.
Download and inspect the outputs
The archive contains the files created during this run. Use these checks when adapting the example to your own data.
- Reconcile the reported results against the downloadable sample inputs.
- Open the generated files and check the contents relevant to your task.
- Review the limitations and any unverified steps in the report.