Sales Data Visualization: a Tokeny case study
Upload sales CSV files to auto-generate trend charts, bar graphs, and key metric dashboards. Follow the recorded task, execution screenshots, actual files and verification notes.
By the Tokeny team · Windows · Tokeny 1.7.8 · gpt-6-sol
Prepare the inputs
Create a separate workspace in Tokeny, download and unpack the sample inputs, then select a model that supports tools. The sample uses synthetic data or the public sources named in the article.
- sales.csv
Send the task to Tokeny
The original task was executed in Chinese. Copying these instructions reproduces the same task; the results below include an English report.
请读取工作空间里的 sales.csv,做一份销售分析。计算每天与渠道的销售额,制作带公式的 sales-report.xlsx 和可独立打开的 dashboard.html(趋势图、渠道柱状图、总销售额与订单行数指标),再写 report.md 解释结果与核对过程。所有金额按 quantity × unit_price 计算。使用本地文件真实执行,输出到当前工作空间,不需要发布。报告须注明是合成演示数据。最后简要列出产物和关键数字。
The recorded run used an isolated demonstration workspace. Review the commands and file paths before approving operations in your own workspace.
What actually ran
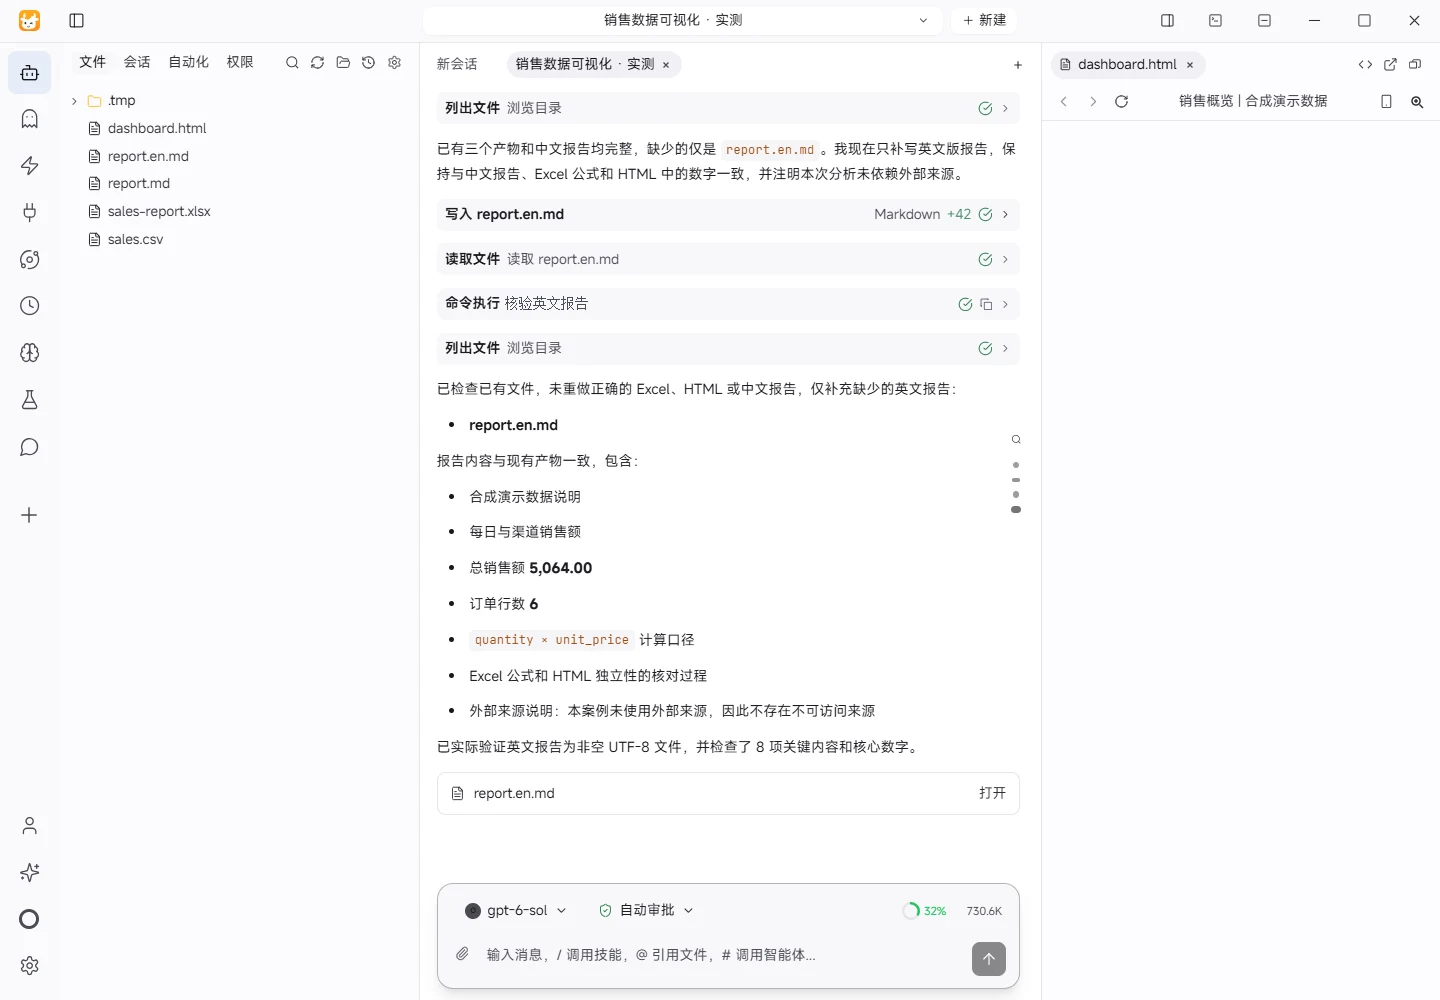
The task was submitted through the Tokeny input box. An online model read the inputs and executed tools. This run covers the local sample task and its actual files. Results and checks are recorded below.
Results and verification
This report uses synthetic demonstration data for illustrating the analysis workflow. It does not represent actual business performance.
Data And Method
- Source:
sales.csvin the current workspace. Fields:date, channel, product, quantity, unit_price. - Period: 2026-10-01 to 2026-10-03; 6 data rows (order lines), 3 dates, and 2 channels. The source has no order ID, so the row count is not interpreted as a count of distinct orders.
- Sales amount rule: every row is calculated strictly as
quantity × unit_price. No discounts, refunds, taxes, or currency conversion are applied. The source does not specify a currency, so the results are reported as amounts without a currency label. - External sources: none were required or used. Therefore, there are no inaccessible external sources to report.
Key Results
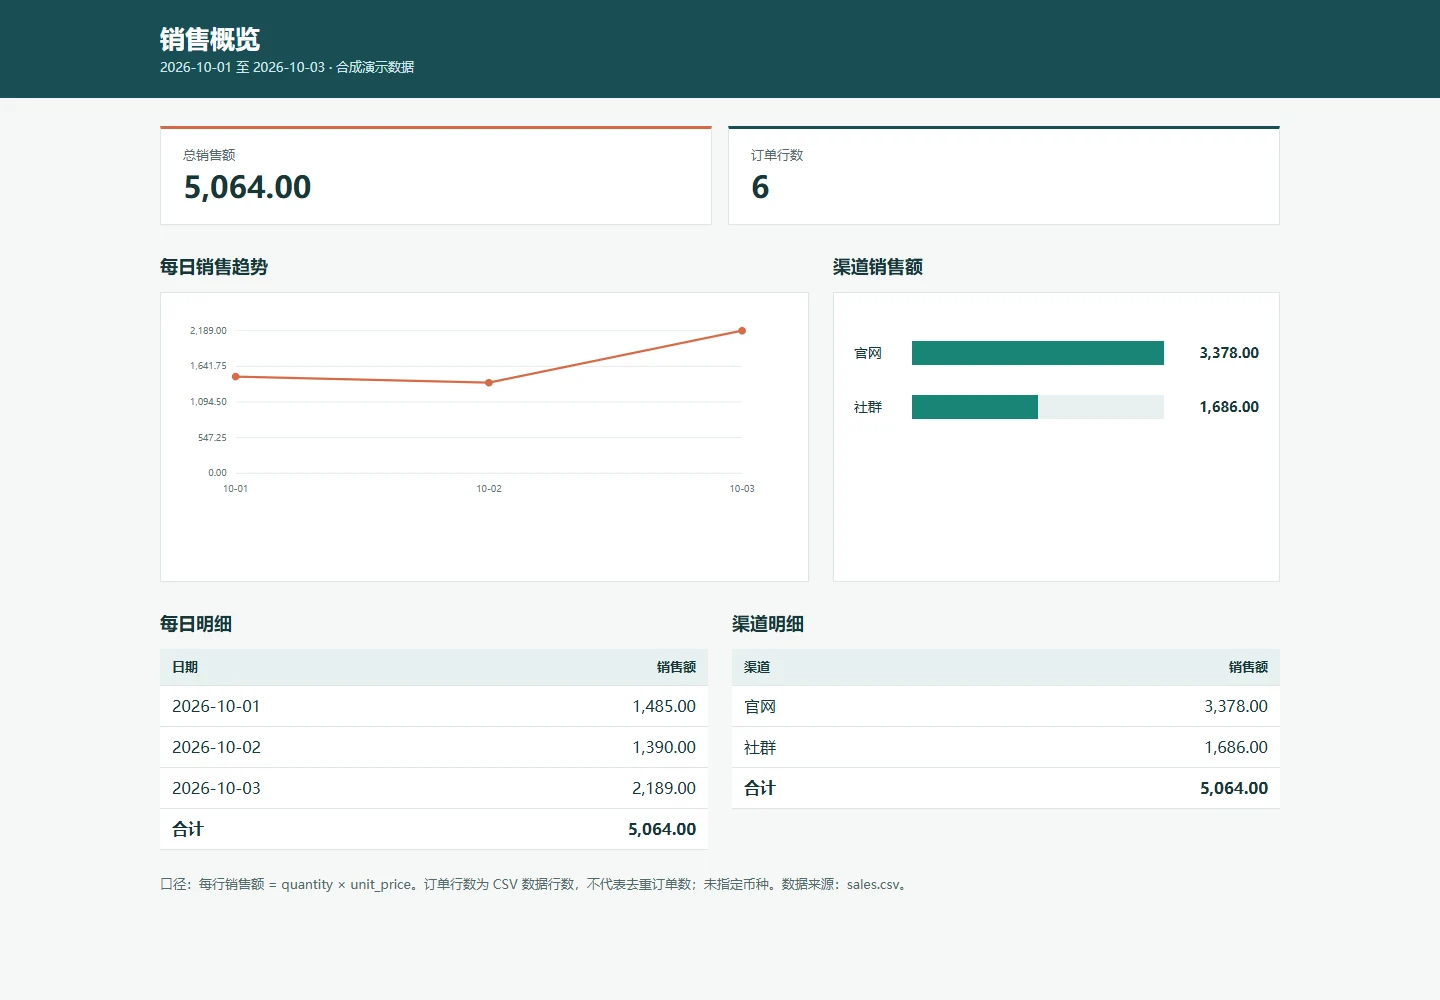
- Total sales: 5,064.00; order lines: 6.
- The highest-sales date was 2026-10-03 with 2,189.00. The lowest-sales date was 2026-10-02 with 1,390.00.
- The largest channel was Official Website (
官网) with 3,378.00, representing 66.71% of total sales. The sample covers only three days, so the trend should not be generalized beyond this demonstration dataset.
Daily Sales
| Date | Sales |
|---|---|
| 2026-10-01 | 1,485.00 |
| 2026-10-02 | 1,390.00 |
| 2026-10-03 | 2,189.00 |
| Total | 5,064.00 |
Channel Sales
| Channel | Sales | Share |
|---|---|---|
Official Website (官网) | 3,378.00 | 66.71% |
Community (社群) | 1,686.00 | 33.29% |
| Total | 5,064.00 | 100.00% |
Verification Process
- Read the source CSV row by row: 6 data rows were found. Date, channel, product, quantity, and unit price were all non-empty; dates parsed successfully; quantities were non-negative integers; unit prices were non-negative with no more than two decimal places; and there were 0 exact duplicate rows. No values were imputed, deduplicated, or removed.
- Independently calculated row amounts with decimal arithmetic: 990.00, 495.00, 796.00, 594.00, 1,592.00, and 597.00. Their sum is 5,064.00.
- The sum of daily subtotals is 5,064.00, and the sum of channel subtotals is also 5,064.00. Both agree with the row-level total.
- In
sales-report.xlsx, the Sales Detail sheet uses=Drow*Erowin column F. The daily and channel sheets useSUMIFover the detail sales amounts. The Overview sheet references the detail total and usesCOUNTAfor the order-line count. Formula cached values were written, and Excel is set to recalculate on open. dashboard.htmlembeds the independently calculated values and SVG charts. It has no external resource dependencies and can be opened locally. Changes to the CSV or workbook do not automatically update the HTML; the generation step must be run again.
Download and inspect the outputs
The archive contains the files created during this run. Use these checks when adapting the example to your own data.
- Reconcile the reported results against the downloadable sample inputs.
- Open the generated files and check the contents relevant to your task.
- Review the limitations and any unverified steps in the report.