A/B Test Evaluation: a Tokeny case study
Import experiment data, calculate statistical significance, and generate visual comparison reports. Follow the recorded task, execution screenshots, actual files and verification notes.
By the Tokeny team · Windows · Tokeny 1.7.8 · gpt-6-sol
Prepare the inputs
Create a separate workspace in Tokeny, download and unpack the sample inputs, then select a model that supports tools. The sample uses synthetic data or the public sources named in the article.
- experiment.csv
Send the task to Tokeny
The original task was executed in Chinese. Copying these instructions reproduces the same task; the results below include an English report.
对 A/B 转化实验进行双侧两比例 z 检验,写出假设、转化率、差值、95% 置信区间、p 值及结论,输出可复算的脚本和 HTML。

交付文件:ab-analysis.html、calculate.py。
验收要点:
- 转化率 10% 和 12.5%
- p 值约 0.077,不能宣布在 0.05 水平显著
- 解释随机分组和多重检验前提
这是使用合成演示输入或指定公开资料的真实操作案例。请先读取工作空间输入,再实际生成文件并自检。所有写入、脚本与临时服务限于当前工作空间;临时服务只监听 127.0.0.1,执行后关闭;不触达外部收件人、不发布、不付款、不更改系统设置,不调用子智能体。需要公开资料时可读取给定 URL。只启用完成任务必需的工具。另写 report.md(中文)和 report.en.md(英文),每份 400–800 字,包含输入、处理步骤、真实结果、检查方式和局限;失败或未验证部分如实记录,不能宣称成功。最终回复用中文列出产物、关键结果与待核实项。
The recorded run used an isolated demonstration workspace. Review the commands and file paths before approving operations in your own workspace.
What actually ran
The task was submitted through the Tokeny input box. An online model read the inputs and executed tools. This run covers the local sample task and its actual files. Results and checks are recorded below.

Results and verification
Input
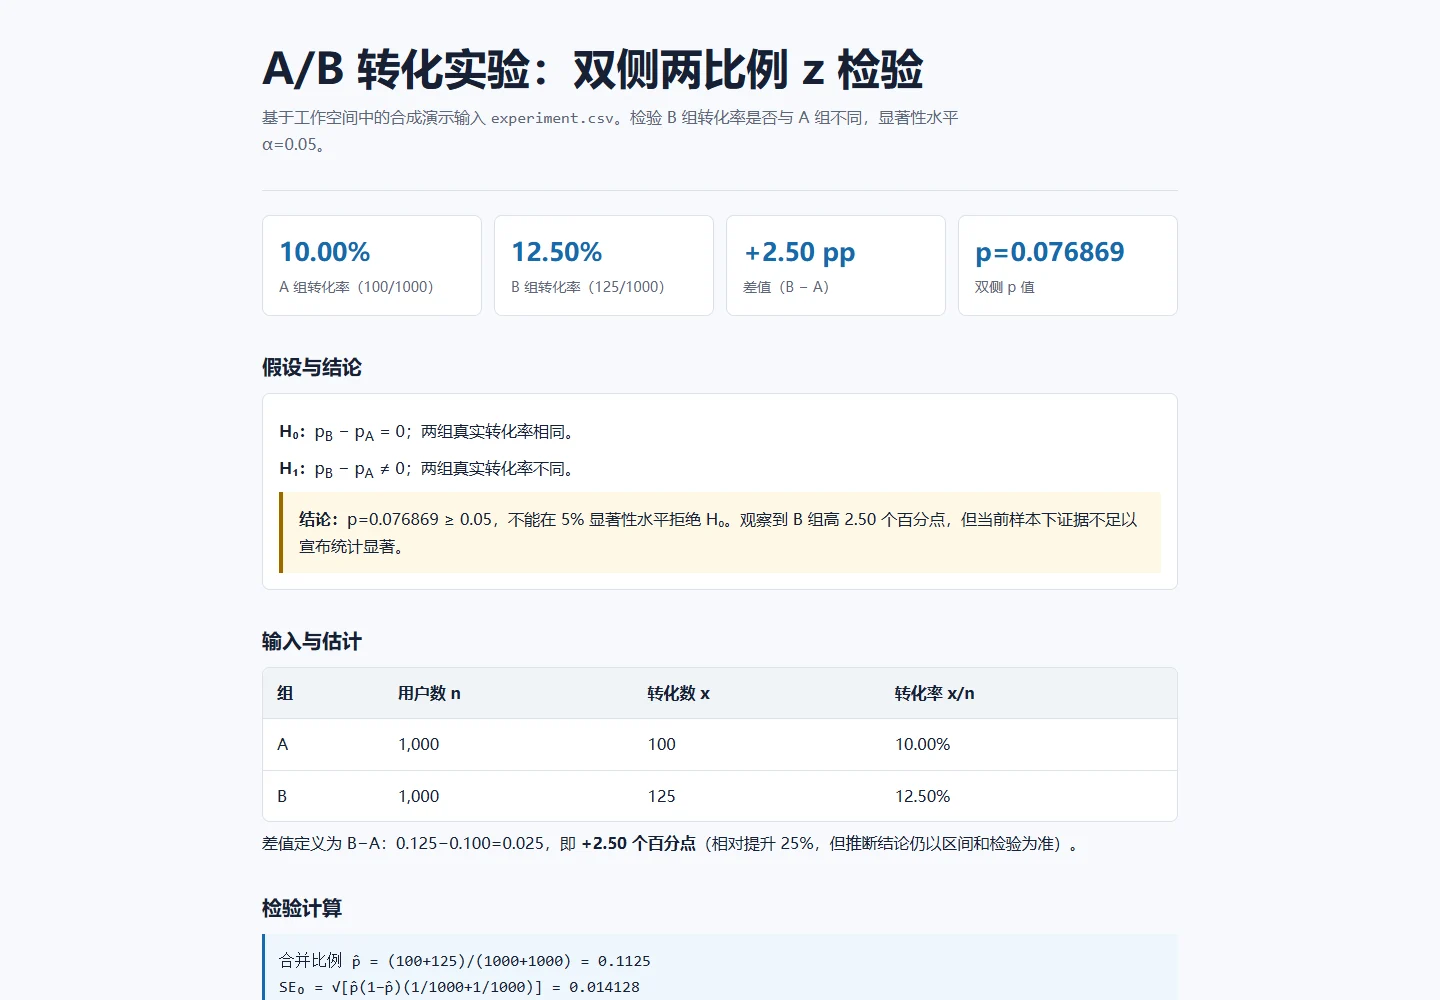
This analysis reads experiment.csv from the current workspace rather than inventing a result. The file contains two variants: 1,000 users and 100 conversions for A, and 1,000 users and 125 conversions for B. The input is a synthetic demonstration experiment, so “actual result” below means the result actually computed from this file, not an estimate validated against a real production population. The estimand was defined as B minus A and the significance level was set to 0.05.
Processing
The script first checks that each group has a positive user count and that conversions fall between zero and the user count. It then computes both conversion rates and performs a two-sided two-proportion z test using the pooled conversion rate for the null standard error. The hypotheses are H0: pB−pA=0 and H1: pB−pA≠0. The 95% confidence interval uses the unpooled two-proportion standard error and the 1.959964 normal critical value. All calculations are in calculate.py, which uses only the Python standard library so that the procedure is easy to reproduce without an undeclared statistics package.
Actual results
The A conversion rate is 100/1,000 = 10.00%; the B rate is 125/1,000 = 12.50%. The B−A difference is 0.025, or +2.50 percentage points. The pooled rate is 0.1125, z=1.769150, and the two-sided p value is 0.076869, approximately 0.077. The 95% confidence interval is [-0.002675, 0.052675], or [-0.2675, 5.2675] percentage points. Because p is above 0.05 and the interval includes zero, H0 cannot be rejected at the 5% level. The observed positive difference is not statistically significant and could be sampling variation.
Checks
Run python calculate.py in the current directory. The output should contain 10.00%, 12.50%, +2.50 percentage points, p=0.076869, and a not-significant conclusion. ab-analysis.html presents the same inputs, formulas, interval, and assumptions for visual review. The script was run successfully and its key numbers were checked against the HTML. No temporary server was started and no external source was accessed.
Limitations
Interpretation depends on random assignment, approximately independent observations, consistent exposure and conversion definitions, and counting each user once. The experiment still needs review for allocation imbalance, cross-group contamination, early stopping, and missing or duplicated users. If many metrics, time windows, audience segments, or variants were examined, unadjusted p values increase the false-positive risk. The primary metric and analysis window should be specified in advance, with a suitable multiplicity procedure such as Holm or Benjamini–Hochberg. The Wald interval can be inaccurate for small samples or extreme rates; here it is used for a transparent demonstration. User-level data were not supplied, so randomization balance, repeated users, and time trends could not be independently checked.
Download and inspect the outputs
The archive contains the files created during this run. Use these checks when adapting the example to your own data.
- Reconcile the reported results against the downloadable sample inputs.
- Open the generated files and check the contents relevant to your task.
- Review the limitations and any unverified steps in the report.