Infographic Creation: a Tokeny case study
Transform complex data or processes into intuitive infographic designs. Follow the recorded task, execution screenshots, actual files and verification notes.
By the Tokeny team · Windows · Tokeny 1.7.8 · gpt-6-sol
Prepare the inputs
Create a separate workspace in Tokeny, download and unpack the sample inputs, then select a model that supports tools. The sample uses synthetic data or the public sources named in the article.
- sales.csv
Send the task to Tokeny
The original task was executed in Chinese. Copying these instructions reproduces the same task; the results below include an English report.
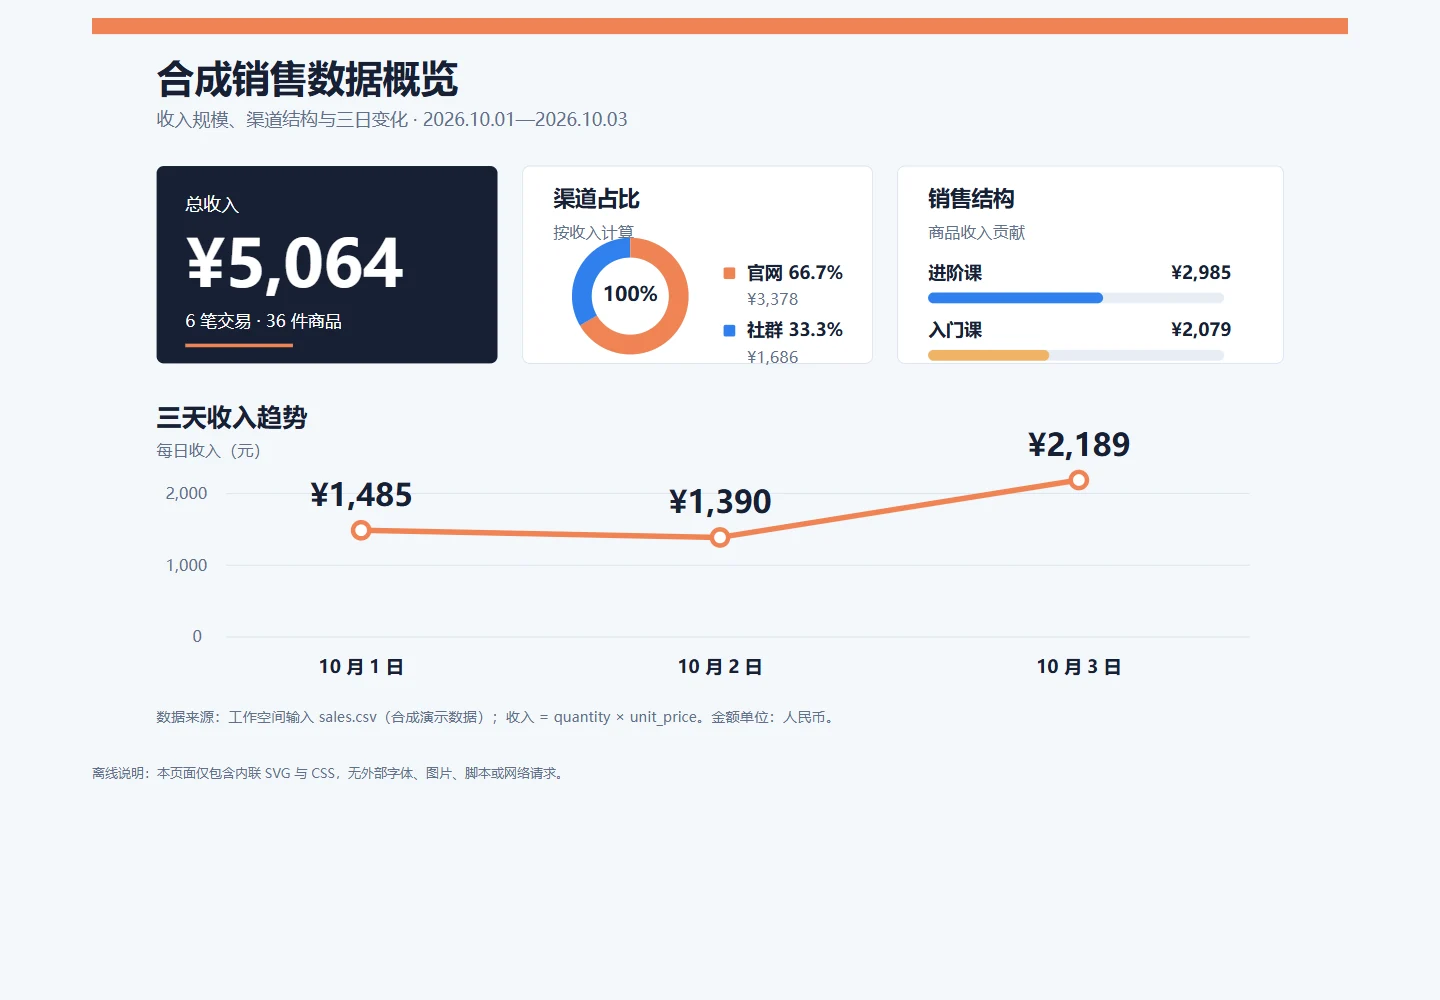
把合成销售数据做成一张横版信息图,突出总收入、渠道占比和三天趋势,输出 SVG 和离线 HTML,不使用外部字体或图片。

交付文件:infographic.svg、infographic.html。
验收要点:
- 5064 元总收入
- 图形有文字标签与数据来源
- 无外部资源依赖
这是使用合成演示输入或指定公开资料的真实操作案例。请先读取工作空间输入,再实际生成文件并自检。所有写入、脚本与临时服务限于当前工作空间;临时服务只监听 127.0.0.1,执行后关闭;不触达外部收件人、不发布、不付款、不更改系统设置,不调用子智能体。需要公开资料时可读取给定 URL。只启用完成任务必需的工具。另写 report.md(中文)和 report.en.md(英文),简洁、完整,包含输入、处理步骤、真实结果、检查方式和局限;失败或未验证部分如实记录,不能宣称成功。最终回复用中文列出产物、关键结果与待核实项。
The recorded run used an isolated demonstration workspace. Review the commands and file paths before approving operations in your own workspace.
What actually ran
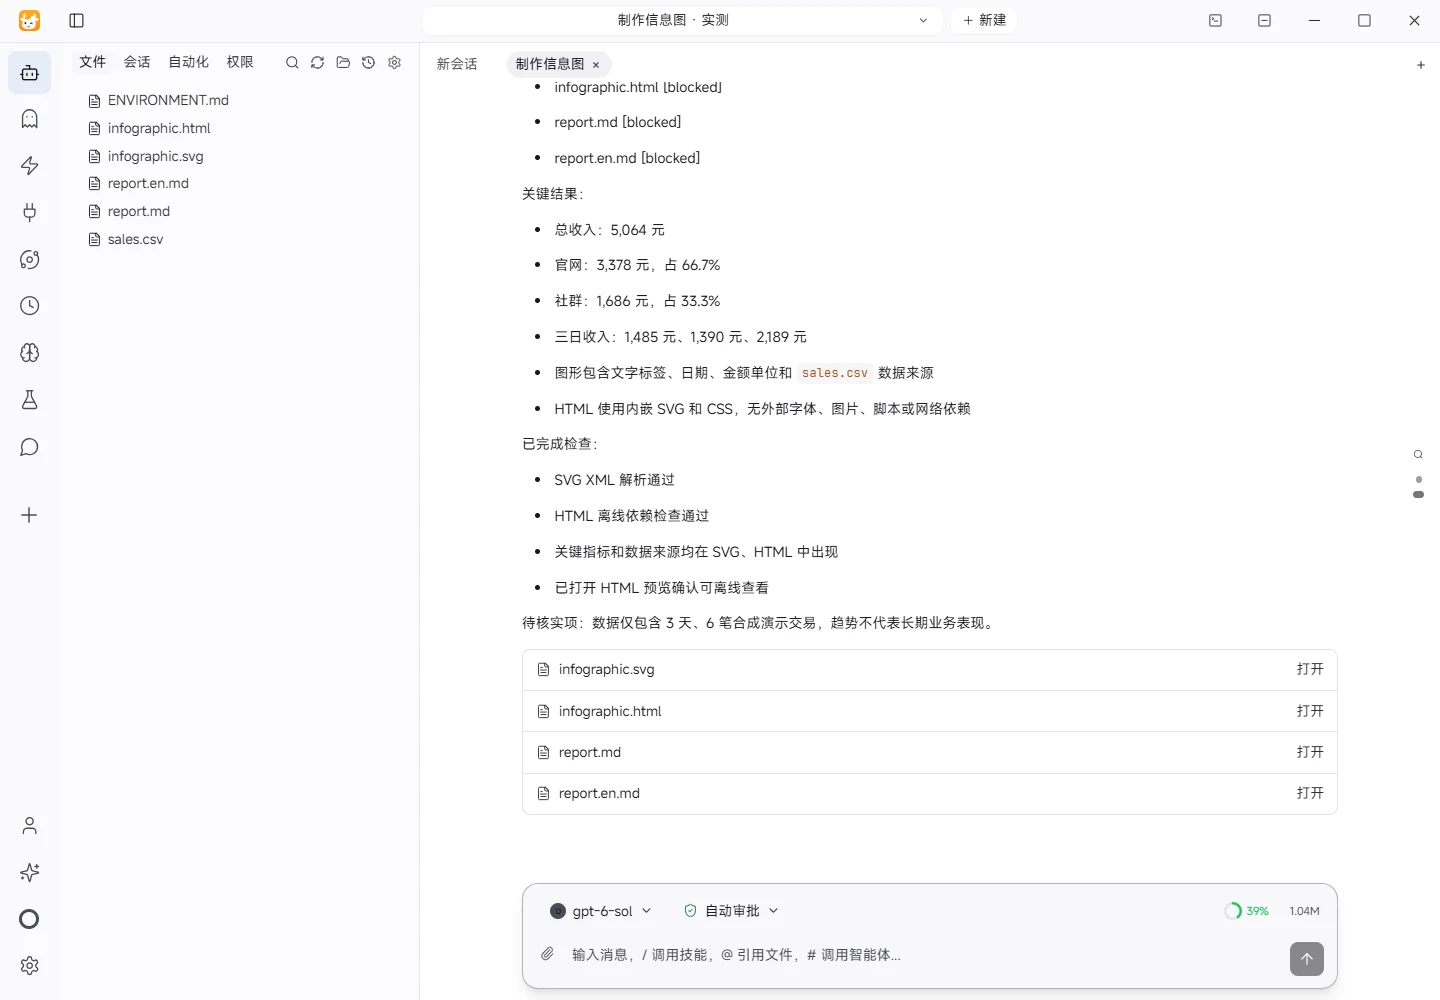
The task was submitted through the Tokeny input box. An online model read the inputs and executed tools. This run covers the local sample task and its actual files. Results and checks are recorded below.
Results and verification
Input
Read sales.csv from the workspace: 6 transaction rows with date, channel, product, quantity, and unit price. The data is synthetic demo input.
Processing
- Calculated line revenue as
quantity × unit_price. - Aggregated total revenue, channel revenue and share, and daily revenue.
- Generated a landscape SVG and embedded the same graphic in an offline HTML page.
- Added labels for key values, units, dates, and data source.
Actual Results
- Total revenue: CNY 5,064.
- Channels: Website CNY 3,378 (66.7%); Community CNY 1,686 (33.3%).
- Daily revenue: Oct 1 CNY 1,485; Oct 2 CNY 1,390; Oct 3 CNY 2,189.
- Products: Advanced Course CNY 2,985; Introductory Course CNY 2,079.
Checks
Verified that the output files exist and are non-empty text files. Verified that both SVG and HTML contain the total, channel labels, three daily values, and the sales.csv source label. Verified that the HTML contains no http://, https://, external image, external font, or script references.
Limitations
The input contains only 6 transactions across 3 days and is synthetic demo data, so the trend is not representative of long-term business performance. Shares are calculated by revenue rather than order count and are rounded to one decimal place.
Download and inspect the outputs
The archive contains the files created during this run. Use these checks when adapting the example to your own data.
- Reconcile the reported results against the downloadable sample inputs.
- Open the generated files and check the contents relevant to your task.
- Review the limitations and any unverified steps in the report.