Data Report Generation: a Tokeny case study
Organize raw data into formatted Excel reports with formulas, charts, and conditional formatting. Follow the recorded task, execution screenshots, actual files and verification notes.
By the Tokeny team · Windows · Tokeny 1.7.8 · gpt-6-sol
Prepare the inputs
Create a separate workspace in Tokeny, download and unpack the sample inputs, then select a model that supports tools. The sample uses synthetic data or the public sources named in the article.
- sales.csv
Send the task to Tokeny
The original task was executed in Chinese. Copying these instructions reproduces the same task; the results below include an English report.
把销售原始数据制成 Excel 报表,包含金额公式、渠道汇总、图表、冻结表头和条件格式,并提供独立核对值。

交付文件:report.xlsx、totals.json。
验收要点:
- 金额公式存在
- 合计 5064
- 有图表和条件格式
这是使用合成演示输入或指定公开资料的真实操作案例。请先读取工作空间输入,再实际生成文件并自检。所有写入、脚本与临时服务限于当前工作空间;临时服务只监听 127.0.0.1,执行后关闭;不触达外部收件人、不发布、不付款、不更改系统设置,不调用子智能体。需要公开资料时可读取给定 URL。只启用完成任务必需的工具。另写 report.md(中文)和 report.en.md(英文),简洁、完整,包含输入、处理步骤、真实结果、检查方式和局限;失败或未验证部分如实记录,不能宣称成功。最终回复用中文列出产物、关键结果与待核实项。
排版检查:Word 主标题仅出现一次,标题为黑色且与后续正文或表格保持同页;Excel 表头和长文字不能被窄列截断,合理设置列宽、换行、行高;HTML 在 390px 视口不能整页横向溢出。报告没有固定字数要求,不要为字数反复改写。
The recorded run used an isolated demonstration workspace. Review the commands and file paths before approving operations in your own workspace.
What actually ran
The task was submitted through the Tokeny input box. An online model read the inputs and executed tools. This run covers the local sample task and its actual files. Results and checks are recorded below.
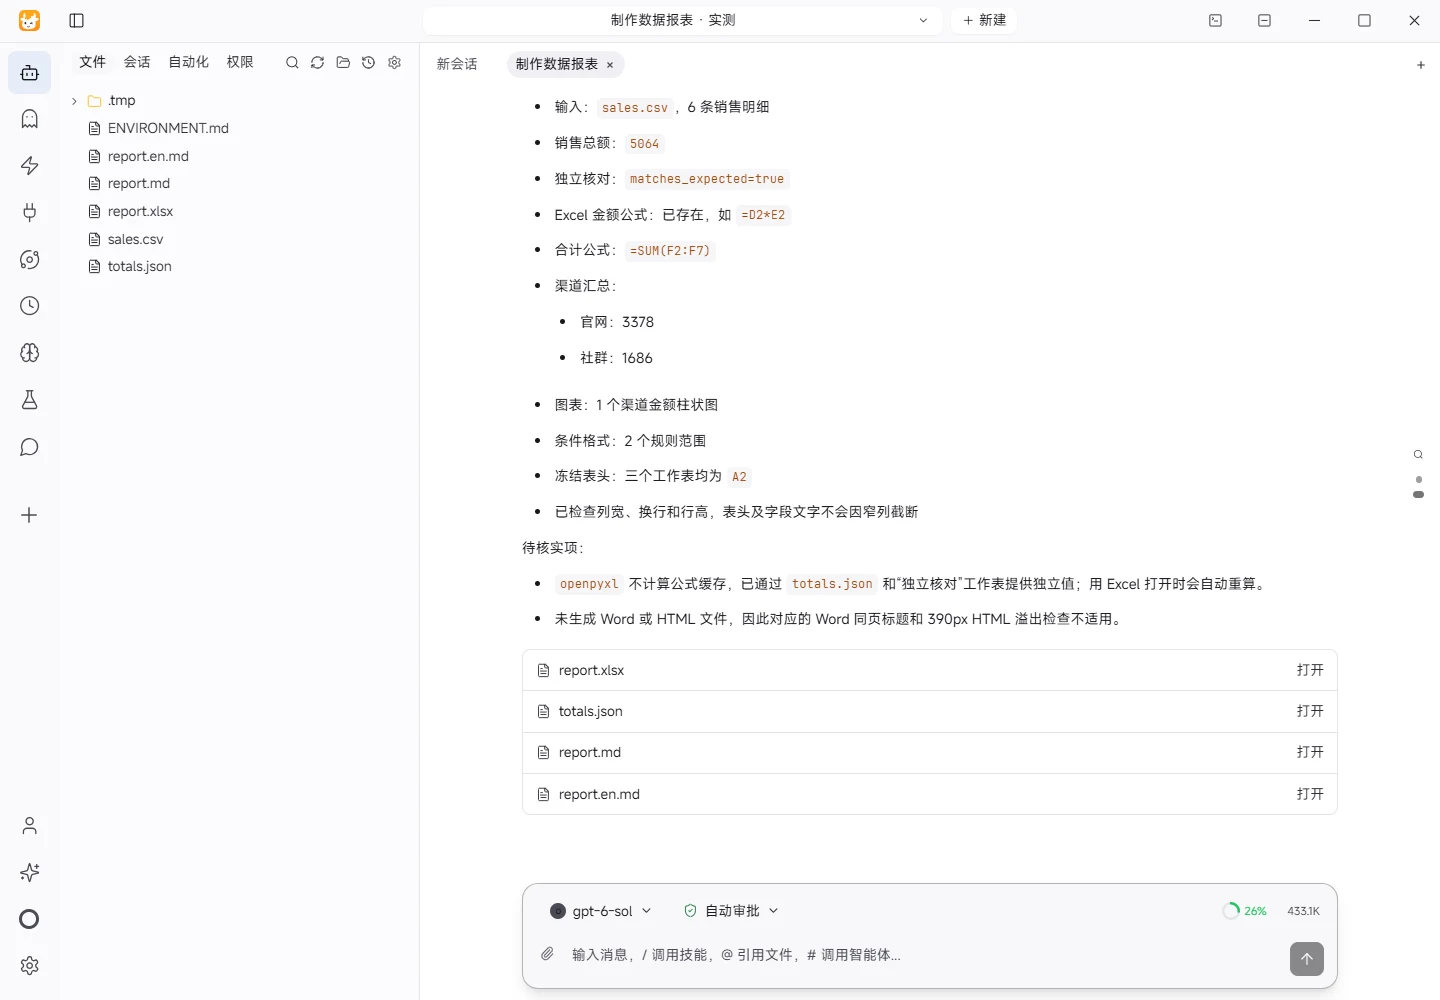
Results and verification
Input
- File:
sales.csv - Content: 6 sales-detail rows with date, channel, product, quantity, and unit price.
- Source: synthetic demonstration input supplied in the current workspace.
Processing
- Read the CSV as UTF-8 and parsed quantity, unit price, and channel fields.
- Wrote the source rows to the
销售明细worksheet. The amount column uses=Drow*Erow; the grand total uses=SUM(F2:F7). - Added a
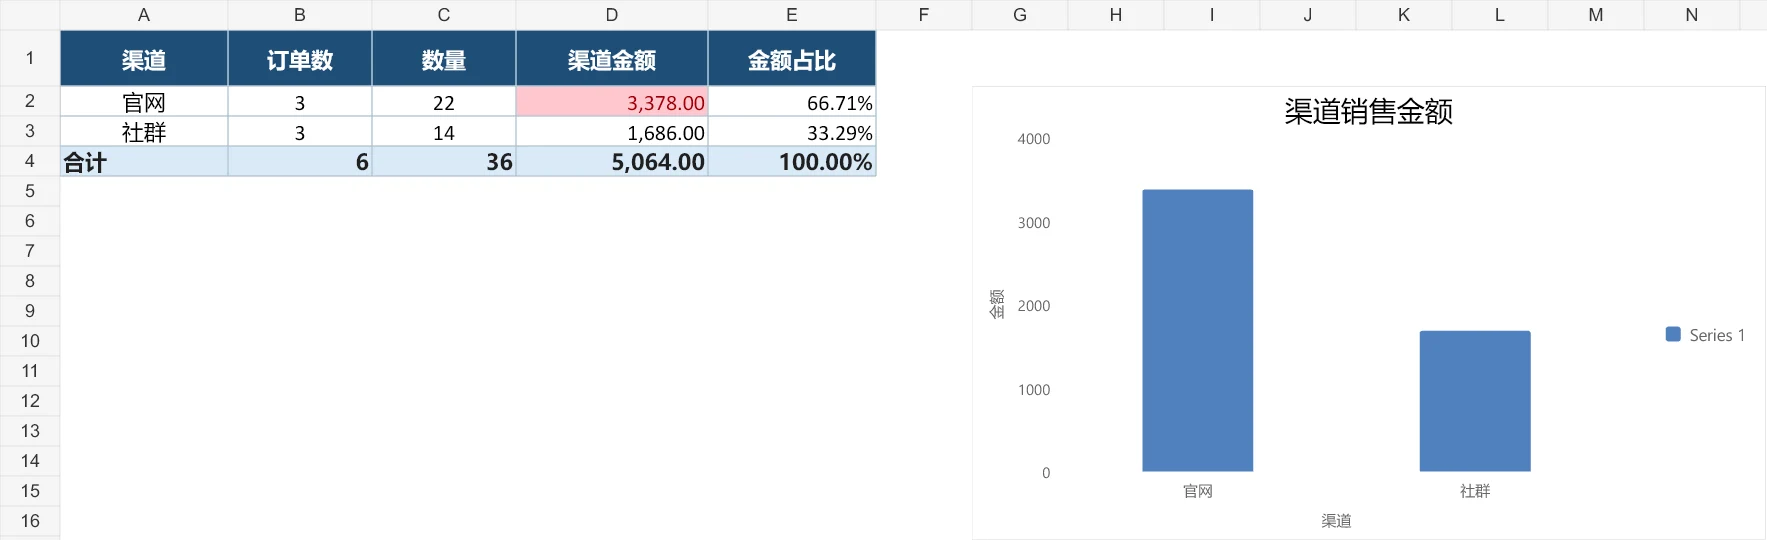
渠道汇总worksheet withSUMIFformulas for orders, quantity, amount, and share by channel, plus a column chart. - Added an independent calculation in the
独立核对worksheet andtotals.json, so verification does not depend on an Excel formula cache. - Applied frozen header panes, practical column widths, wrapping, borders, number formats, and amount/quantity conditional formatting.
Actual Results
- Detail rows: 6
- Total quantity: 36
- Total sales amount: 5064
- 官网: 3 orders, 22 units, 3378
- 社群: 3 orders, 14 units, 1686
- Target total 5064: matches
- Excel charts: 1 channel-amount column chart
- Conditional-formatting ranges: 2
- Frozen header panes:
A2on all three worksheets
Verification
- Reopened
report.xlsxand checked that detail amount, grand-total, and channel-summary formulas exist. - Inspected workbook structure for the chart, conditional formatting, and frozen panes.
- Read
totals.jsonand confirmedtotal_amount=5064.0andmatches_expected=true. - Checked column widths and wrapping so headers and long text are not clipped by narrow columns.
Limitations
openpyxlwrites formulas but does not calculate their cached values. Independent values are therefore provided intotals.jsonand独立核对; Excel will recalculate on open.- No Word or HTML file was requested or generated, so the Word same-page title check and 390px HTML overflow check are not applicable.
Download and inspect the outputs
The archive contains the files created during this run. Use these checks when adapting the example to your own data.
- Reconcile the reported results against the downloadable sample inputs.
- Open the generated files and check the contents relevant to your task.
- Review the limitations and any unverified steps in the report.